Haag’s Hurricane Geoportal can help you keep an eye on the data!
Haag is now offering site-specific GIS mapping and analysis for storm data. When a hurricane hits, it can be difficult to find detailed information quickly about that storm–What were the maximum wind gusts at a particular site? Where did storm surges have the biggest impact? Does the hurricane track or wind swath from one storm overlap with a previous storm? How can I access the Local Climatological Data summary for a particular storm?
Applying GIS data to an assignment area helps you determine storm intensity and damage potentials at a given area, helping you clearly assess damage. Through the Haag Geoportal, you’ll have access to an interactive web-mapping platform with project specific information for your location of interest, as well as hurricane-related GIS data, including:
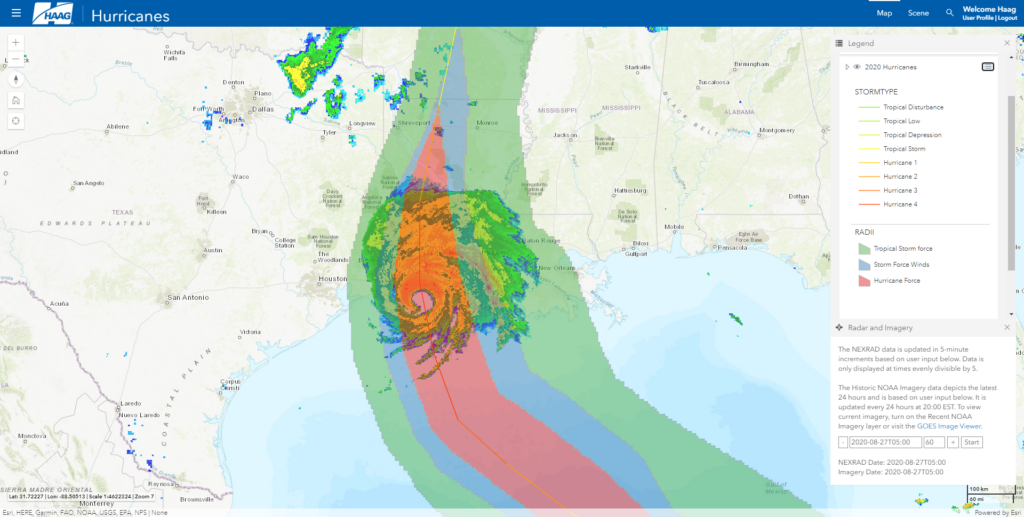
NOAA Wind Intensity Points
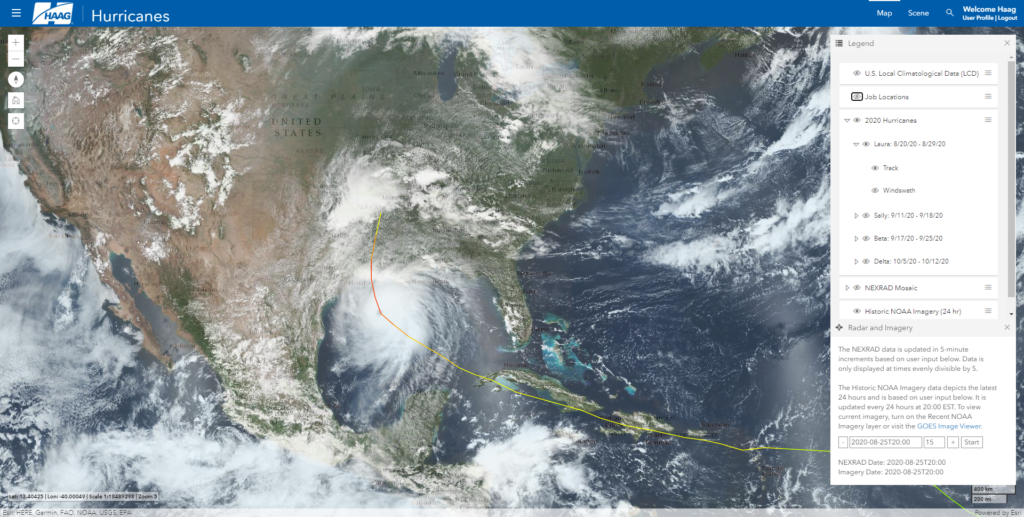
NOAA Hurricane Track
NOAA Wind Swath
NOAA Wind Radii
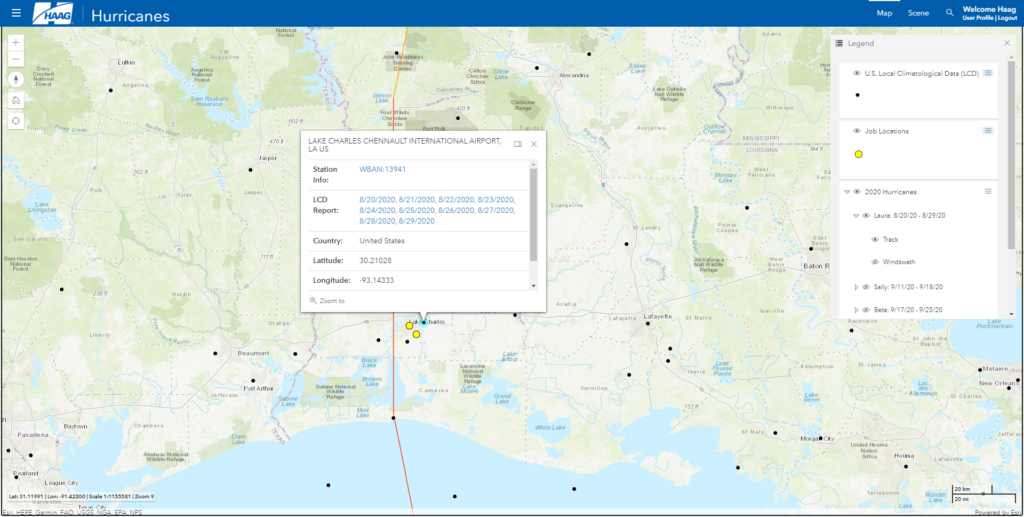
NOAA U.S. Local Climatological Data Points with links to daily and hourly observations
NEXRAD Mosaic
Historic NOAA Satellite Imagery
All projects include access to our web mapping interface with standard features (legend; interchangeable base-maps; measure tool; drawing tools; map formatting for quick printing capabilities; map coordinate search; basic data search capabilities). We also offer the option to include additional information that is specific to your project such as orthomosaic image overlays, project photos/files, and more.
For more information on Haag’s Hurricane Geoportal or to schedule a demo, please contact Marcie Deffenbaugh, GIS Services Manager or call 800-635-0118.